

Are we ready to predict percutaneous nephrolithotomy (PCNL) stone-free failure?
Article authors


1 The Federal State Institute of Public Health ‘The Nikiforov Russian Center of Emergency and Radiation Medicine’, Saint-Petersburg, Russian Federation
2National Pirogov Medical Surgical Centre, Saint Petersburg, Russia
3Saint Elizabeth Hospital, Saint Petersburg, Russia
Abstract
Objective: To develop a tool, both simple and reliable, for postoperative percutaneous nephrolithotomy (PCNL) stone-free failure prediction.
Materials and methods: We analysed a sample of 116 patients, who underwent conventional PCNL from 2011 to 2014. Cases with residual stones < 4 mm in size were regarded as clinically insignificant and ‘stone-free’.
Results: According to the low-dose computed tomography (CT) scan performed within 24 hours after operation, the patients were stratified as follows: 72 stone-free and 44 with residual stones. Among the analysed variables, three were derived as most important for prediction purposes: an additional stone in a calyx with an acute angle ( ⩽ 45°), represented by ‘A’; an additional stone in a long calyx ( < 10 mm) with a narrow infundibulum ( < 8mm), represented by ‘C’; and a stone size that is > 24 mm, represented by ‘S’. These were abbreviated as the ‘ACS’ score. Depending on the absence or presence of each of these three variables, a score of 0 or 1 was assigned. If the ACS score is 0, then the probability of being a stone-free patient was about 88%; however, when the ACS score is 3, then the probability of being stone free was just 8%.
Conclusion: Use of the ACS score seemed to be a simple and reliable tool for PCNL stone-free failure prediction.
Keywords Computed tomography, kidney, kidney stones, outcome, percutaneous nephrolithotomy, predictive value, quality control, residual stones, scoring system, urolithiasis
Introduction
Since introduction of percutaneous nephrolithotomy (PCNL) into clinical practice in 1941, when Rupel and Brown performed the first nephroscopy, application of this method has undergone steady growth, with the number of PCNLs performed annually in the USA increasing by 47%, between 1999 and 2009. 1,2 It is not a secret that reduced achievement of subjective preoperative surgical goals are associated with decreased patient satisfaction; thus, ability to predict the stone-free rate before operation leads to accurate patient counselling, better surgical planning and might serve to obtain better surgical outcomes. 3 A number of approaches to predict the postoperative stone-free rate were developed: STONE nephrolithometry, 4 GUY’s stone score, 3 Staghorn morphometry, 5 the logistic regression model, 6 K1–4 classification, 7 the Nephrolithometric Nomogram proposed by CROES, 8 etc. Although these tools are able to provide predictive value, unfortunately, they are not without drawbacks; being cumbersome in one case and non-reliable in the other cases. Therefore, reliable prognostic tools are needed to counsel patients preopera tively, optimize treatment selection, plan surgery and eval uate outcomes. 8 Our main objective was to develop both a reliable and at the same time simple tool, which could be helpful in routine urological practice.
Materials and methods
After institutional ethical committee approval, we retrospec tively evaluated a sample of 116 patients from 2011 to 2014. The most influential variables affecting the PCNL stone-free rate, according to the publications we extracted from PubMed and Google Scholar, using main keywords such as ‘PCNL’, ‘prediction’, ‘scoring system’, ‘stone-free’ and ‘outcome’ were: age, sex, body mass index (BMI), stone density, opera tive time, hydronephrosis, laterality, number of tracts, American Society of Anesthesiologists (ASA) grade and number of PCNL sessions. Additionally, three parameters are gained with multiplanar reconstruction of computed tomog raphy (CT) data (Figure 1): A stone in a calyx with an acute angle to the main stone burden, 45° (‘Acute Angle’ or ‘A’); a stone in a long calyx ( 10 mm) with narrow infundibulum ( 8 mm), in additional to the main stone burden (‘Complicated Calyx’ or ‘C’) and a ‘Stone Size’ or ‘S’ meas ured in the longest dimension of that stone’s mass (mm). All operations were performed by two competent sur geons, according to Jean De la Rosette et al., 9 with more than 60 cases done by each. Our surgical technique is described elsewhere. 10 We defined stone-free status as either when there was no residual fragment or the residual fragment was ⩽ 4 mm on low-dose CT scan, 24 hours after PCNL. 11 Inclusion criteria were the following: Patients who under went conventional PCNL for stones, with non-anomalous kidneys and in whom low-dose CT scan was performed within 24 hours for evaluation of being stone free. We excluded 32 patients with complex renal stones (complete staghorn stones or partial staghorn stones with multiple cal yceal stones) from the analysis, due to their participation in our biomodeling study. 10 The association of the evaluated variables with the stone-free rate was our outcome measure.
Statistical analysis
Statistical analyses, the Receiver Operation characteristic (ROC) analysis in particular, were performed using software called PAST, 12 MedCalc (http://www.medcalc.org/) and XLStat (http://www.xlstat.com/en/). We realised the calcula tion of exact Bayesian confidence (credible) intervals for proportions (sensitivity ( Se) , specificity ( Sp) , positive predic tive value (PPV) and negative predictive value (NPV)) and the MOVER confidence intervals for the ratios of some of them (positive likelihood ratio ( LR [+]) and negative likeli hood ratio ( LR [–])). 13 Statistical significance of the observed effects was tested by P values and confidence intervals (CIs). For expression of the clinical importance of findings, the socalled ‘effect size’ was used. 13,14 As measures of the effect size, the area under the ROC-curve (AUC) was used. Values around 0.001 were considered as a critical significance level.
Results
According to the low-dose CT scan performed within 24 hours after the operation, the patients were stratified as fol lows: 72 patients were rendered as stone free and 44 as stone-free failures. Their demographic and clinical data as well, are presented in Table 1.
Both subgroups appeared to be equal in relation to age, BMI and gender proportions. A score of R = 0 was assigned to the patients with residual fragments 4 mm, which were rendered as stone-free; and a score of R = 1 was assigned to the patients with residuals 4 mm, whom were rendered as stone-free failures. The AUC = 0.77 (with 95% confidence limits = 0.69–0.86) was achieved, yet for one the most informative characteristics, the stone size (S), with the corresponding cut-off point (COP) = 24 mm (Figure 2(a)).
Such an AUC value was compatible with AUCs obtained using the nephrolithometric nomogram (AUC = 0.76). 8 For other preoperative variables, AUCs were much less inform ative (close to uninformative value AUC = 0.5) and are not shown here. So using the cut-off point, we could reduce the ‘Stone size’ or ‘S’ to the following score: S = 0 for stone size ⩽ 24 mm and S = 1 for stone size > 24 mm.
Discrimination and prediction capabilities were improved, when two of the most informative discrete char acteristics’ variables were added into account: ‘Acute Angle (A)’ and ‘Complex Calyces (C)’; with the scores 0 and 1, for their absence and presence, respectively.
The ROC-curve obtained from a logistic regression for the combined three parameters, namely ACS, appeared to be more informative. For this curve, AUC = 0.87, with 95% confidence limits from 0.78 to 0.94 (Figure 2(b)): This corresponds with the findings of Z Okunov et al. 4 in a STONE nephrolithometry study.
The distribution of ACS scores between two groups with residual fragments ( R = 1) and with clinically insig nificant fragments ( R = 0) appeared to be, statistically, extremely heterogeneous ( P = 3 ∙ 10 -9 ); however, this observed heterogeneity was only when all three ACS parameters were present (ACS = 3) or all were absent (ACS = 0). As a result, we were able to create two 2*2 Gadzhiev et al. 3 contingency tables, called confusion matrices, for these two extreme values of combined ACS scores (Table 2).

Figure 1. CT-derived parameters for ‘ACS’: (a) for the ‘A’: the acute angle; (b) for the ‘C’: the complicated calyx; and (c) the CTderived parameter for the ‘S’: the stone size. ACS: Scoring system for kidney stones developed using CT-based findings after PCNL; PCNL: percutaneous nephrolithotomy
Thus, if the ACS score = 3, then the probability of stone-free failure is about 92% (or probability of being stone free was just 8%); and if the ACS score is 0, then the probability of rendering the patient stone-free is about 88% (Figure 3). The intermediate values of ACS = 1 and ACS = 2 didn’t show any clinical significance.
Discussion
Unfortunately, despite the variety of existing tools for PCNL stone-free rate prediction, many of them are not deprived of drawbacks; among others, there are three worth mentioning: The Guy’s score, STONE nephrolithometry and the CROES nomogram, which are, according to a recently-published study, shown to be equally predictive of the stone-free state in patients undergoing PCNL.15 Guy’s score, as proposed by Thomas et al., 3 evaluating the state of being ‘stone-free’, uses plain radiography, which is substantially less sensitive than CT for detecting calcified stone fragments. The stone-free rates that are reported seem low (62% overall), particularly given the authors’ inclusive definition. This may depend in part on patient selection, the technology that was utilized for treatment (for example, the type of lithotrite), and the provider’s threshold to stage procedures in patients with complex stones, owing to concerns regarding complications.16
Table 1. Demographic and clinical data.
VariableSFSaP-value
Yes (< 4 mm)No (> 4 mm)
Patients, n (%)72 (62%)44 (38%)
Age (years); median (range)50 (21 – 84)51 (26 – 77)0.96
Sex (gender), n (%)
Female41 (57%)26 (59%).85
Male31 (43%)18 (41%)
BMI (kg/m2)26.0 27.6 28.226.0 28.5 30.50.22
Stone size (S) (mm)16 19 2126 35 417∙10-7
Density (HU)974 1100 1200749 920 10110.044
Hydronephrosis, n (%)
Yes46 (64%)25 (57%)0.56
No26 (36%)19 (43%)
Stone location, n (%)
Left41 (57%)22 (50%)0.57
Right31 (43%)22 (50%)
Tracts, n (%, 95%CI)
160 (83%)29 (66%)0.085
25 (7%)8 (18%)
36 (8%)7 (16%)
41 (1%)0
ASA score, n (%, 95%CI)
114 (19%)3 (7%)0.27
242 (58%)29 (66% )
315 (21%)11 (25%)
41 (1%)1 (2%)
Sessions, n (%, 95%CI)
171 (99%)28 (64%)3∙10-7
21 (1%)14 (36%)
30 (0%)2 (4%)
Complex Calyces (C)
Yes (C = 1)4 (6%)20 (55%)4∙10-7
No (C = 0)68 (94%)24 (55%)
Acute Angle (A)
Yes (A = 1)4 (6%)24 (55%)3∙10-9
No (A = 0)68 (94%)20 (45%)
Size of RSF (mm)0.8 1.2 1.58.6 10.5 12.3-
aData are shown as medians; the lower and upper limits of 95%CI are given as left and right subscripts.
ASA: American Society of Anesthesiologists; BMI: body mass index; RSF: residual stone fragments; SFS: stone-free state

Figure 2(a). ROC-curve for the Stone Size AUC = 0.69 0.77 0.86 and COP = 24 mm. AUC: the area under the ROC curve; COP: cut-off point; ROC: receiver operation characteristic

Figure 2(b). ROC-curve for the combined ACS scores: AUC = 0.78 0.87 0.94. ACS: 3-parameter based scoring system tried in this paper; AUC: the area under the ROC curve; pred: prediction; res: residual; ROC: receiver operation characteristic
Table 2. Confusion matrices for ACS = 3 (top) and ACS = 0 (bottom).
ACS scoreResidual fragment size scoresTotalPrediction probabilitiesa
R = 1R = 0
311011PPV = 0.74 0.92 1.00
All others3372105NPV = 0.59 0.68 0.77
Total4472116
Discrimination probabilitiesSe = 0.15 0.26 0.40Sp = 0.95 0.99 1.00 AUC = 0.52 0.63 0.73
Likelihood ratiosLR[+] = 4.6 19.3 754.9LR[–] = 1.1 1.3 1.6
ACS scoreResidual fragment size scores TotalPrediction probabilities
R = 0R = 1
050656PPV = 0.78 0.88 0.95
All others223860NPV = 0.51 0.63 0.74
Total7244116
Discrimination probabilitiesSe = 0.58 0.69 0.79Sp = 0.73 0.85 0.94 AUC = 0.69 0.77 0.87
Likelihood ratiosLR[+] = 2.5 4.5 10.7LR[–] = 2.0 2.7 4.1
aData are shown as medians; the lower and upper limits of 95%CI are given as left and right subscripts.
ACS: Current test based on three parameters, each represented by an initial; AUC: area under the ROC-curve; BMI: body mass index; LR: likelihood ratio (followed by a plus is a positive ratio and followed by a minus is a negative ratio); NPV: negative predictive value; PPV: positive predictive value; ROC: receiver operation characteristic; RSF: residual stone fragments; Se: sensitivity;
SFS: stone-free state; Sp: specificity
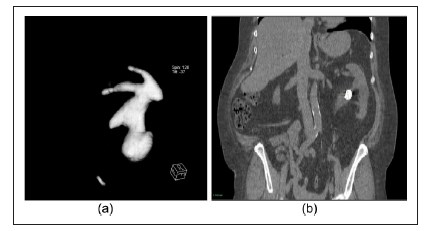
Figure 3. Scoring of ACS: (a) All three parameters present: ACS score = 3; and (b) All three parameters absent: The ACS score = 0.STONE nephrolithometry, developed by Z Okunov,4 being one of the most comprehensive predicting tools and having much the same AUC as the ACS score, contained points such as the skin-to-stone distance, stone density and presence of hydronephrosis, which were not associated with the presence of residual stones. The CROES nomogram, by a group of authors from CROES,8 so far has the biggest sample size, gained from 96 centres worldwide and it has the power to detect any statistically-significant differences, having an almost similar AUC with STONE,15 corroborated with the nomogram’s prior stone treatment; and the case volume per year, was as well making consideration of the stone-free rate be more comprehensive. Nevertheless, the data obtained from such centres is not homogenous, because the centres had different methods to assess both stone-free rates and operative times,17 and the patients examined for treatment success by Kidney Ureter Bladder (KUB) were also included in the study. This may potentially have resulted in a misinterpretation of some variables, and also given lower predictive capacity.
With the ACS scores provided having an AUC = 0.87, considered as a large effect, we were able to predict the probability of stone-free failure when the main variables are present in 92% of patients; while with having none of those parameters, the stone-free rate could be predicted with 88% probability.
In our study, we did not find any association with stone density, in contrast to some other studies.18,19 Moreover, it was consistent with the findings of the study for CROES nomogram, and perhaps the reason was that stone density does not play any role in facilities having all equipment for efficient stone disintegration and a final pelviocalyceal fiberscope inspection at the end of the PCNL as an obligatory part of the operation.
Hydronephrosis, despite its possible influence on a stone-free rate as has been mentioned in some studies,6,20 did not affect the stone-free rate in our study. The ability of a surgeon to combine both ultrasound (US) and X-ray guidance for gaining access, and a strict adherence to the operative protocol as well, could be a reasonable explanation for this observation.
One of the most important factors was stone size, which is consistent with the other works4,21; and the ROC analysis showed that stone size is able to affect the stonefree state, when it is larger than 24 mm. Unsurprisingly, two other factors, an additional stone in a long calyx (⩾ 10 mm) with narrow infundibulum (⩽ 8 mm) and an additional stone in a calyx with an acute angle ⩽ 45° were shown to be the next most informative, on a discrete analysis, and improved AUC significantly. The explanation seemed quite obvious: The above-mentioned parameters making necessary additional tract creation to achieve complete stone removal are associated with a higher haemorrhage complication rate, and this may influence the stone-free status.22 Our study had several limitations: First, our study is retrospective in its origin; and second, we did not account for the case volume per year, as it has previously been demonstrated that centres with a volume of cases > 120 per year have superior surgical outcomes.11 All our PCNL cases’ treatments were performed by competent surgeons, skilled in USand X-ray-based navigation. Third, we do recognize that despite acceptance by CROES of the size of clinically-insignificant residuals being ⩽ 4 mm, the definition of being stone-free should become much stricter, according to existing reports.23 Lastly, we did not take into account previous surgical treatment, which can obviously affect the stone-free rate.
References
1. Ghani KR, Sammon JD, Bhojani N, et al. Trends in percutaneous nephrolithotomy use and outcomes in the United States. J Urol 2013; 190: 558–564. Available from: http://www. sciencedirect.com/science/article/pii/S0022534713003066 (accessed 8 December 2014).
2. Patel SR and Nakada SY. The modern history and evolution of percutaneous nephrolithotomy. J Endourol 2014. Available from: http://www.ncbi.nlm.nih.gov/pubmed/ 25093997 (accessed 31 December 2014).
3. Thomas K, Smith NC, Hegarty N, et al. The Guy’s stone score: Grading the complexity of percutaneous nephrolithotomy procedures. Urology 2011; 78: 277–281. Available from: http://www.goldjournal.net/article/S0090429510021643/ fulltext (accessed 31 December 2014).
4. Okhunov Z, Friedlander JI, George AK, et al. S.T.O.N.E. nephrolithometry: Novel surgical classification system for kidney calculi. Urology 2013; 81: 1154–1159. Available from: http://www.ncbi.nlm.nih.gov/pubmed/23540858 (accessed 31 December 2014).
5. Mishra S, Sabnis RB and Desai M. Staghorn morphometry: A new tool for clinical classification and prediction model for percutaneous nephrolithotomy monotherapy. J Endourol 2012; 26: 6–14. Available from: http://www.ncbi.nlm.nih. gov/pubmed/22050495 (accessed 31 December 2014).
6. Zhu Z, Wang S, Xi Q, et al. Logistic regression model for predicting stone-free rate after minimally invasive percutaneous nephrolithotomy. Urology 2011; 78: 32–36. Available from: http://www.ncbi.nlm.nih.gov/pubmed/21296398 (accessed 31 December 2014).
7. Yanenko E, Hurzev K and Makarova T. Classification of staghorn nephrolithiasis and treatment algorithm. Book of abstracts of 4th All-Soviet Urology Conference, 31 March 1990, pp. 600–601 (in Russian).
8. Smith A, Averch TD, Shahrour K, et al. A nephrolithometric nomogram to predict treatment success of percutaneous nephrolithotomy. J Urol 2013; 190: 149–156. Available from: http://www.ncbi.nlm.nih.gov/pubmed/23353048 (accessed 31 December 2014).
9. De la Rosette JJ, Laguna MP, Rassweiler JJ, et al. Training in percutaneous nephrolithotomy: A critical review. Eur Urol 2008: 994–1003. Available from: http://www.urosource. com/fileadmin/European_Urology/european_urology/ PIIS0302283808003424.pdf (accessed 2 January 2015).
10. Gadzhiev N, Brovkin S, Grigoryev V, et al. Sculpturing in urology, or how to make percutaneous nephrolithotomy easier. J Endourol 2014. Available from: http://www.ncbi. nlm.nih.gov/pubmed/25321395 (accessed 2 January 2015).
11. Kamphuis GM, Baard J, Westendarp M, et al. Lessons learned from the CROES percutaneous nephrolithotomy global study. World J Urol 2014. Available from: http:// www.ncbi.nlm.nih.gov/pubmed/25100624 (accessed 14 August 2014).
12. Hammer Ø, Harper DAT and Ryan PD. PAST: Paleontological statistics software package for education and data analysis. Palaeontol Electron 2001; 4: 1–9. Available from: http://palaeo-electronica.org/2001_1/past/ past.pdf (accessed 2 January 2015).
13. Newcombe RG. Confidence intervals for proportions and related measures of effect size. 2012. Boca Raton: CRC Press. Available from: http://www.google.ru/books?hl=r u&lr=&id=hQxvnp2b47YC&pgis=1 (accessed 2 January 2015).
14. Kraemer HC, Frank E and Kupfer DJ. How to assess the clinical impact of treatments on patients, rather than the statistical impact of treatments on measures. Int J Meth Psychiatr Res 2011; 20: 63–72. Available from: http://www.ncbi.nlm. nih.gov/pubmed/21520328 (accessed 2 January 2015).
15. Labadie K, Okhunov Z, Akhavein A, et al. Evaluation and comparison of urolithiasis scoring systems used in percutaneous kidney stone surgery. J Urol 2015 1;193:154–159. Available from: http://www.sciencedirect.com/science/article/ pii/S0022534714041421 (accessed 29 December 2014).
16. Matlaga BR and Hyams ES. Stones: Can the Guy’s Stone Score predict PNL outcomes? Nat Rev Urol 2011; 8: 363– 364. Available from: http://www.ncbi.nlm.nih.gov/pubmed/ 21743448 (accessed 2 January 2015).
17. Bucuras V, Gopalakrishnam G, Wolf JS, et al. The Clinical Research Office of the Endourological Society Percutaneous Nephrolithotomy Global Study: Nephrolithotomy in 189 patients with solitary kidneys. J Endourol 2012; 26: 336–341. Available from: http://www.mendeley.com/catalog/clinicalresearchoffice-endourological-society-percutaneous-nephrolithotomyglobal-study-nephrolith (accessed 2 January 2015).
18. Kacker R, Meeks JJ, Zhao L, et al. Decreased stone-free rates after percutaneous nephrolithotomy for high calcium phosphate composition kidney stones. J Urol 2008; 180: 958–960. Available from: http://www.ncbi.nlm.nih.gov/ pubmed/18639270 (accessed 22 December 2014).
19. Gücük A, Uyetürk U, Oztürk U, et al. Does the Hounsfield unit value determined by computed tomography predict the outcome of percutaneous nephrolithotomy? J Endourol 2012; 26: 792–796. Available from: http://www.ncbi.nlm. nih.gov/pubmed/22201298 (accessed 2 January 2015).
20. Binbay M, Akman T, Ozgor F, et al. Does pelvicaliceal system anatomy affect success of percutaneous nephrolithotomy? Urology 2011; 78: 733–737. Available from: http:// www.ncbi.nlm.nih.gov/pubmed/21676442 (accessed 21 December 2014).
21. De la Rosette JJ, Zuazu JR, Tsakiris P, et al. Prognostic factors and percutaneous nephrolithotomy morbidity: A multivariate analysis of a contemporary series using the Clavien classification. J Urol 2008; 180: 2489–2493. Available from: http://www.ncbi.nlm.nih.gov/pubmed/18930485 (accessed 2 January 2015).
22. El-Nahas AR, Shokeir AA, El-Assmy AM, et al. Postpercutaneous nephrolithotomy extensive hemorrhage: A study of risk factors. J Urol 2007; 177: 576–579. Available from: http://www.ncbi.nlm.nih.gov/pubmed/17222636 (accessed 2 January 2015).
23. Raman JD, Bagrodia A, Gupta A, et al. Natural history of residual fragments following percutaneous nephrostolithotomy. J Urol 2009; 181: 1163–1168. Available from: http://www.ncbi.nlm.nih.gov/pubmed/19152935 (accessed 18 February 2015).